Reducing Variability in Cytokine Activity Reporting
Ensuring the quality and consistency of ancillary materials used in the manufacture of cell and gene therapies is critical to both controlling costs and ensuring the integrity of the therapeutic product.
It is our responsibility as ancillary material manufacturers to reduce the variability that biomanufacturing presents. This is especially important when considering the manufacture of recombinant proteins for further manufacturing use. Because these products are biologics in and of themselves (in addition to the therapeutic products they enable), they represent critical materials that must be controlled and released in a way that ensures consistency. The primary means by which recombinant protein manufacturers can ensure consistency in therapy developers’ manufacturing processes is by ensuring a reproducible process, as well as a reproducible means of measuring and reporting Specific and Biological Activity.
Cell therapy companies often rely on the lot-specific Activity Values (reported in International Units) on their supplier’s Certificates of Analysis (CoA) to measure the amount of material being used in their manufacturing processes. However, it is critical to realize that the values reported by different cytokine manufacturers cannot be directly compared with confidence if they do not adopt the same approach to measuring Activity and analyzing the results. This matters because any variability in the way that Activity Values are analyzed and reported will affect the consistency of the therapeutic product.
Relative Potency
To measure and report activity on its Recombinant Human Interleukin-2 (rHu IL-2), Akron utilizes a parallel-line concentration-response model to estimate a relative potency compared to the National Institute for Biological Standards and Control (NIBSC) reference, applying the principles outlined in USP <1032> Design and Development of Biological Assays & USP <1034> Analysis of Biological Assays.
Other cytokine manufacturers take a simplified approach when calculating Activity Values, as explained below. This, along with other differences in assay methodology, can result in reported values that are not directly comparable. We caution against using Activity Values to measure and dilute samples for comparability assays between different manufacturers. It is important for the industry to align with best practices around the determination and reporting of cytokine activity. This can ultimately ensure a more robust and resilient supply base, ensuring that therapy developers can assess suppliers accurately, and onboard secondary suppliers without the need for extensive and costly comparability assessments.
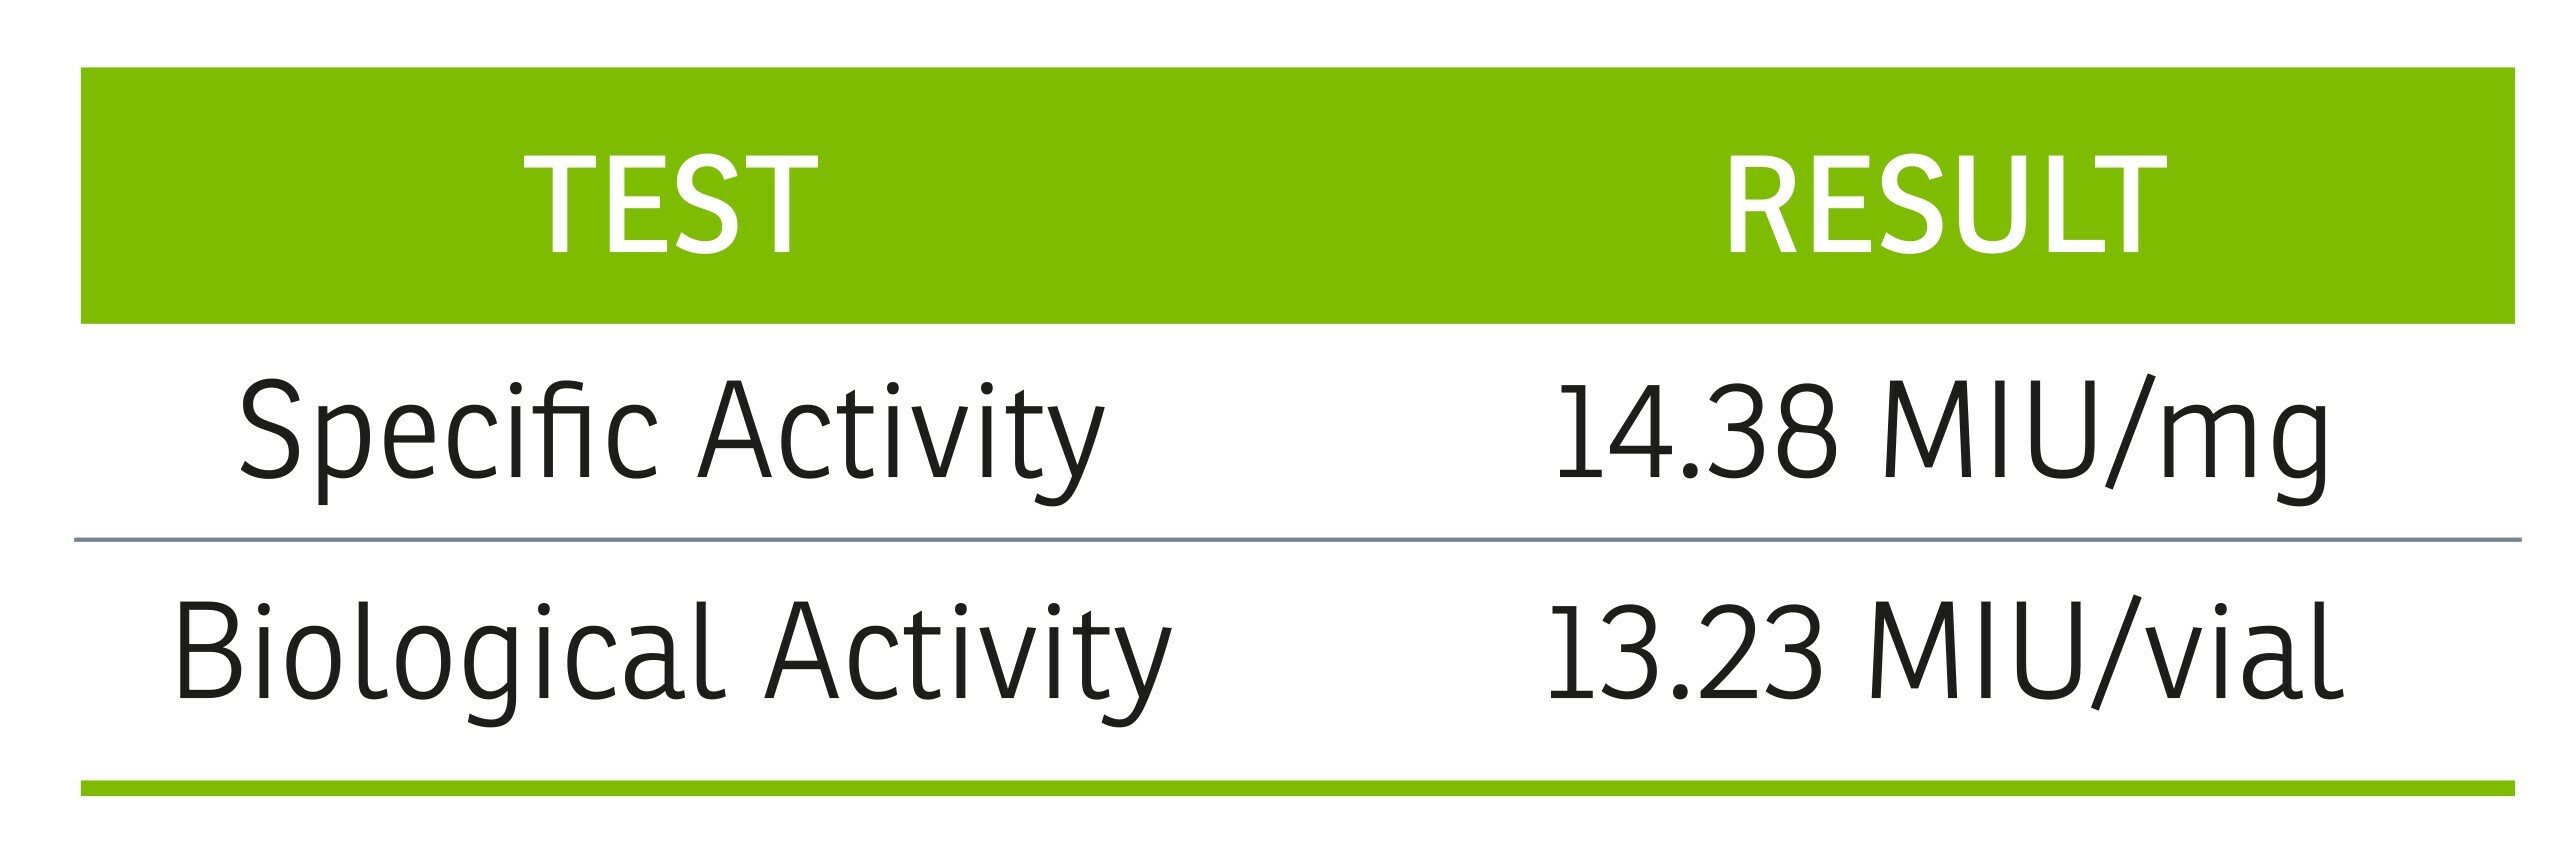
The World Health Organization employs a parallel-line approach when determining potency for the current International Standard for IL-2 (NIBSC 86/500).1 Akron’s reported IL-2 Specific Activity levels are usually very similar to the Specific Activity of the current international standard (NIBSC 86/500), which is known to be approximately 13.73 MIU/mg.2
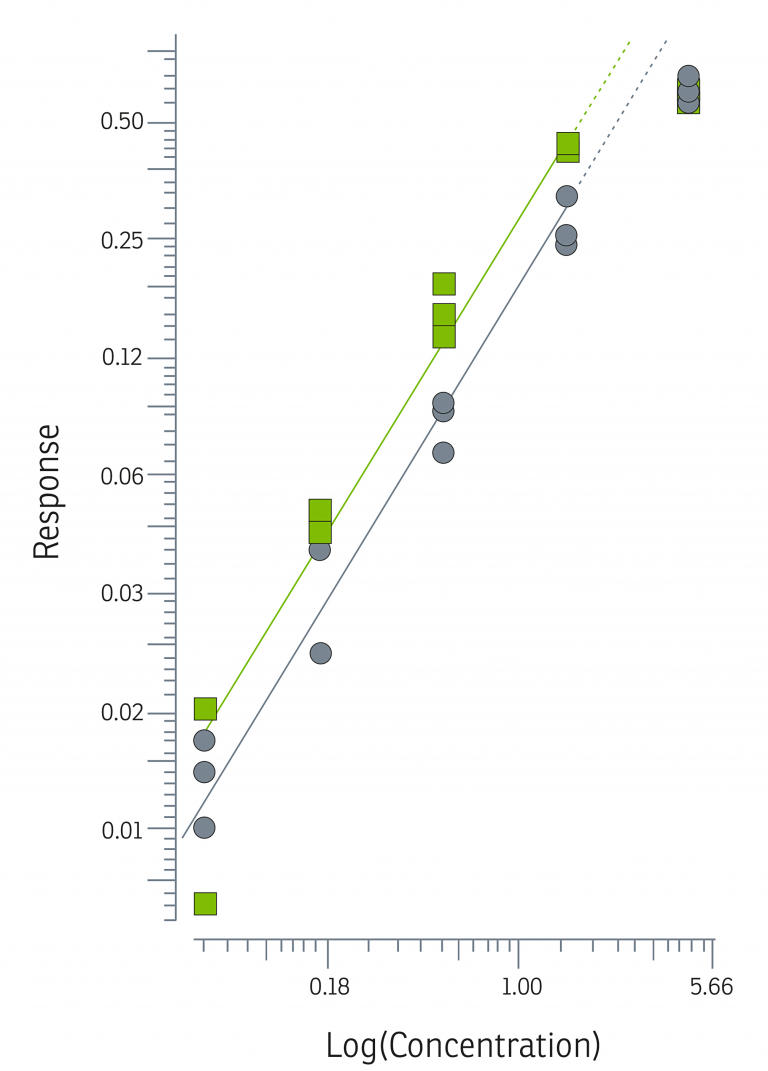
See below for a simplified example of the model Akron uses to compare relative potency by plotting biological response vs. log (concentration) for a test sample and a reference standard. The horizontal distance between these graphs represents the difference in concentration needed by the reference standard and the test sample to generate the same biological response. This defines relative potency.
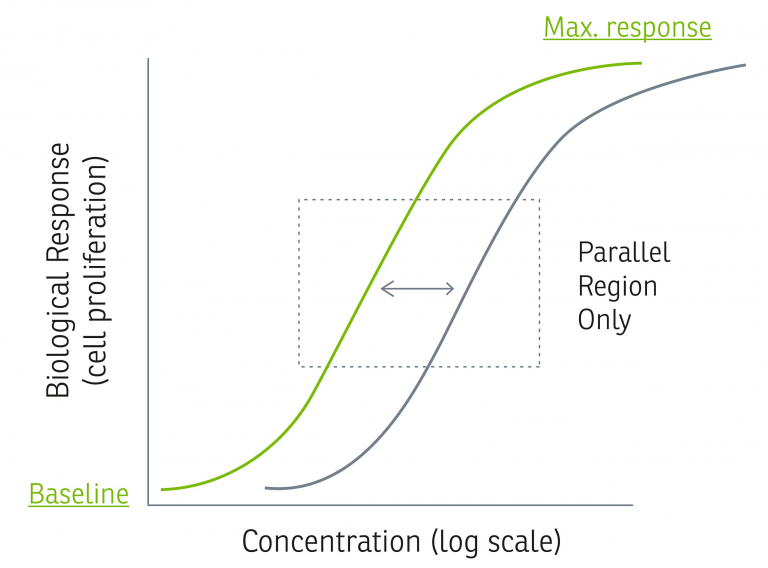
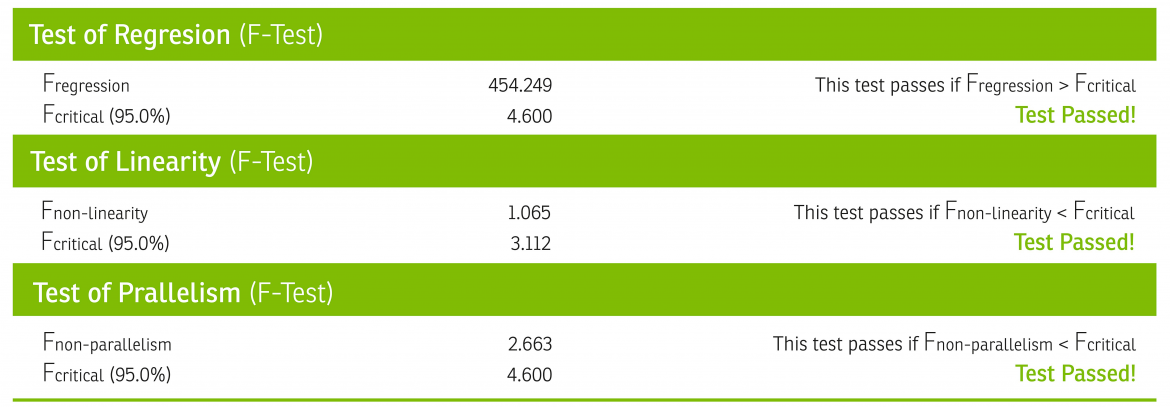
The parallel, linear regions for the samples in this model are compared to estimate a relative potency, only if they first pass statistical validity tests for regression, linearity, and parallelism. Per USP <1032>, biologically similar compounds will produce statistically similar response behavior, and although these statistical similarities do not ensure biological similarity, their failure may be taken as evidence against biological similarity.3
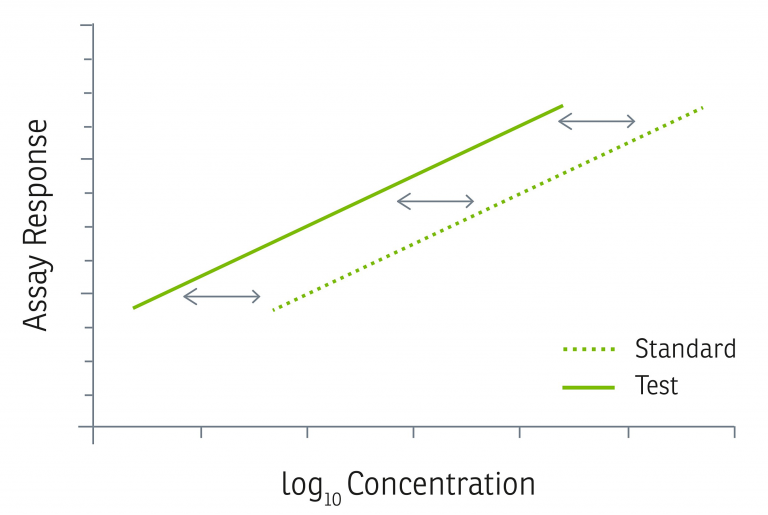
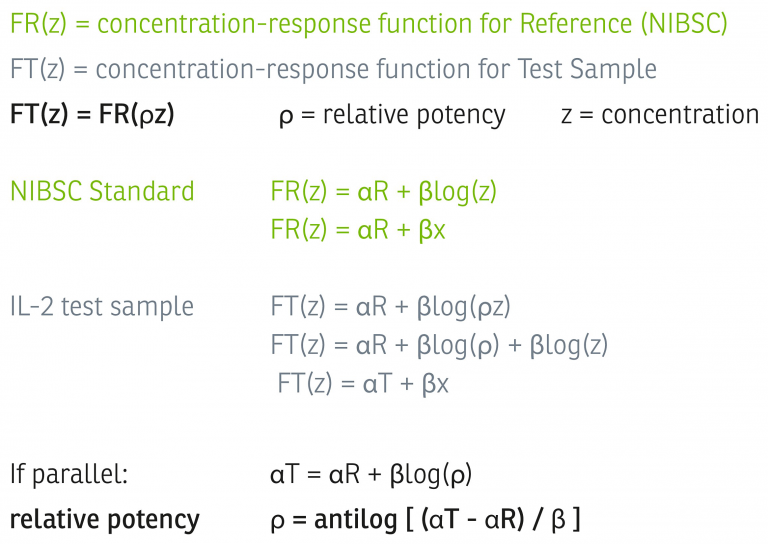
Once found to be statistically valid, we assume biological similarity and parallelism, and a relative potency is calculated by directly comparing the concentration-response function of the test sample to the concentration-response function of the reference standard, as shown in the graph and equations below, adapted from USP <1034>.4
Alternative Method for Calculating Activity Levels
The commonly employed alternative method for calculating Activity Levels, used by many cytokine manufacturers, is to determine the ED50 using the entire concentration-response graph and convert that directly into Specific Activity as shown in the graph and equation below.
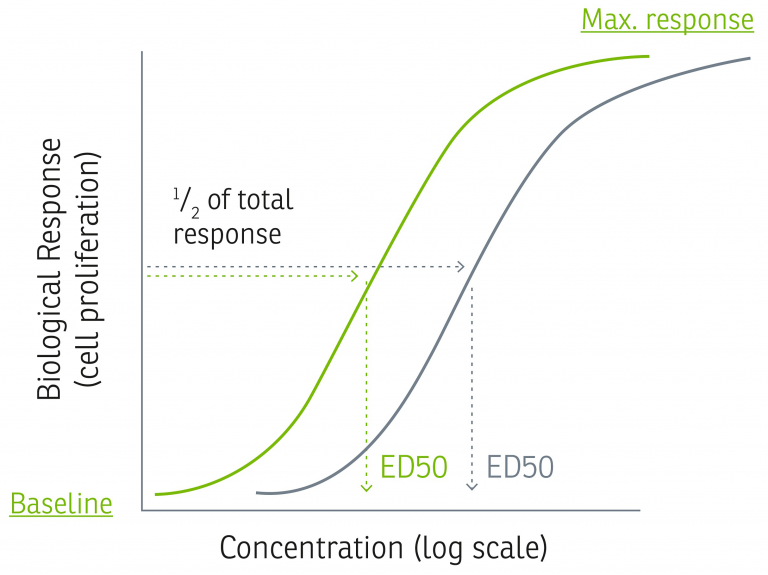
ED50 is the concentration (ng/mL) that results in 50% of the maximum response. By applying the above equation, one can calculate a Specific Activity reported in U/mg. This then needs to be normalized against a reference with known potency so that Specific Activity in IU/mg can be reported, which is supposed to be a universally comparable value.
In our experience, for cytokine activity, there is more error involved when calculating a relative Specific Activity using the ED50 value rather than using a parallel-line model. This is supported by the following guidance in USP <1032> regarding variance:
“Simple analysis of quantitative bioassay data requires that the data be approximately normally distributed with near constant variance across the range of the data.”3
“In practice, many bioassays have relatively large variation in log EC50 (compared to the variation in log relative potency) among assays (and sometimes among blocks within assay). If not addressed in the variance model, this variation in log EC50 induces what appears to be large variation in response near the mean log EC50…”3
If manufacturers use different methods to measure and calculate Specific Activity, there will be completely different sources of error, resulting in Activity Values that should not be directly compared. Relative Activity Values can only be compared relatively, which means they must result from the same comparability testing protocol and data analysis methodology.
One of the simple options available for companies looking to compare cytokines from different manufacturers via comparability assays is to measure and dilute the test samples according to mass concentration, rather than the reported Specific Activity. If a known and trusted reference standard is included during this comparison, the relative Specific Activities of the test samples can be recalculated and compared using these results.
How Akron Can Help
It is in our interests as a community of suppliers seeking to accelerate the development and commercialization of cell and gene therapies to standardize the assays that most directly impact our customers’ manufacturing processes. Only through greater standardization can we hope to achieve the resilient supply chains, cost of goods reductions, and manufacturing robustness that define a mature industry. We welcome the chance to partner with our colleagues and with therapy developers to ensure greater standardization in the supply base. Please reach out to engage with us on standardization efforts and discuss strategies for increasing robustness in your supply of critical ancillary materials.
Learn about Akron’s cGMP Recombinant Cytokines and Growth Factors portfolio.
Contact us about validating our ancillary materials in your manufacturing process.
References
- Wadhwa, M., Bird, C., Heath, A., Thorpe, R. Report on a Collaborative study for proposed 2nd International standard for Interleukin -2 (IL-2). Expert Committee on Biological Standardization WHO/BS/2012.2194.
- WHO International Standard 2nd International Standard for INTERLEUKIN 2 (Human, rDNA derived) NIBSC code: 86/500. Instructions for Use (Version 1.0, Dated 23/04/2013).
- USP <1032> Design and Development of Biological Assays. USP-NF
- USP <1034> Analysis of Biological Assays. USP-NF